Russia-affiliated scholars publishing about internationalisation of higher education (based on Scopus)
A quantitative investigation based on Scopus
DOI for this research note: https://doi.org/10.5281/zenodo.14791245
Objective of this research note
Outline trends in the publication record of Russia-affiliated scholars writing about internationalisation of higher education and publishing their work in established scholarly journals.
Operationalisation of the objective
Rely on the Scopus API to search for all articles published:
- between 2011 and 2024
- in the following subject area ‘SOCI’
- matching in either the title, the abstract, or the author-provided article keywords the following string: ‘higher education’
- considering other criteria for narrowing further the number of results in subsequent steps
- in any Scopus-indexed journal
- considering the option to limit results to top ranked journals (e.g. Q1 and Q2)
Additional notes clarifying some of these choices
- Why set 2011 as the start date?
- data availability: according to the official Scopus website, journal CiteScore data are effectively available only starting with 2011; as CiteScore is used for filtering Q1 and Q2 publications, this criteria could scarcely be consistenyly applied retroactively (“the first journal metric values for CiteScore are available for 2011” - https://service.elsevier.com/app/answers/detail/a_id/29859/)
- relevance: the focus is on policies favouring internationalisation of higher education that gained traction in Russia mostly in the 2010s
- pragmatic considerations: in previous years, the number of publications focused on higher education by Russia-affiliated scholars is anyway negligible
- Why set only SOCI as the subject area?
- pragmatic considerations: a separate test including also “ECON” and “ARTS” has been conducted; the number of additional unique matches was limited, and often less relevant
- clarity: an explicit focus on social sciences Scopus-indexed journals enhances clarity in the case selection
- Why rely only on “higher education” as keyword?
- pragmatic considerations: additional contiguous keywords, such as “university”, brought in a large number of spurious matching; domain-specific keywords (e.g. “Bologna process”) may have skewed results; ultimately, if an article really focuses on internationalisation of higher education it is strongly expected that it will use that expression in either title, abstract, or user-selected keywords
- Why only journal publications, and not e.g. book chapters?
- pragmatic considerations: focusing on journal articles allows to differentiate publications based on ranking
Data retrieval
The data was downloaded from Scopus API in January 2025 via api.elsevier.com and www.scopus.com.
See:
Differentiate articles
Articles are differentiated based on a set of criteria:
- articles with at least an author with a Russian affiliation?
- articles published in Q1 and Q2 journals VS all Scopus-indexed publications
- articles that are specifically about internationalisation of higher education, base on a narrow or slightly broader set of criteria.
The same analysis and graphs will be reproduced based on each set of criteria.
| year | All | No Russian affiliation | Russian affiliation | Russian affiliation share |
|---|---|---|---|---|
| 2011 | 4073 | 4057 | 16 | 0.39% |
| 2012 | 4399 | 4341 | 58 | 1.32% |
| 2013 | 4991 | 4941 | 50 | 1.00% |
| 2014 | 5450 | 5328 | 122 | 2.24% |
| 2015 | 6126 | 5837 | 289 | 4.72% |
| 2016 | 6481 | 6134 | 347 | 5.35% |
| 2017 | 7115 | 6802 | 313 | 4.40% |
| 2018 | 8287 | 7829 | 458 | 5.53% |
| 2019 | 9915 | 9373 | 542 | 5.47% |
| 2020 | 11552 | 11014 | 538 | 4.66% |
| 2021 | 12404 | 11894 | 510 | 4.11% |
| 2022 | 13497 | 13041 | 456 | 3.38% |
| 2023 | 14666 | 14200 | 466 | 3.18% |
| 2024 | 18532 | 18142 | 390 | 2.10% |
| year | All | No Russian affiliation | Russian affiliation | Russian affiliation share |
|---|---|---|---|---|
| 2011 | 1595 | 1594 | 1 | 0.06% |
| 2012 | 1797 | 1788 | 9 | 0.50% |
| 2013 | 2130 | 2124 | 6 | 0.28% |
| 2014 | 2143 | 2134 | 9 | 0.42% |
| 2015 | 2376 | 2362 | 14 | 0.59% |
| 2016 | 2608 | 2595 | 13 | 0.50% |
| 2017 | 2994 | 2956 | 38 | 1.27% |
| 2018 | 3672 | 3588 | 84 | 2.29% |
| 2019 | 4317 | 4139 | 178 | 4.12% |
| 2020 | 5426 | 5169 | 257 | 4.74% |
| 2021 | 6197 | 5901 | 296 | 4.78% |
| 2022 | 7350 | 7076 | 274 | 3.73% |
| 2023 | 8556 | 8267 | 289 | 3.38% |
| 2024 | 11344 | 11117 | 227 | 2.00% |
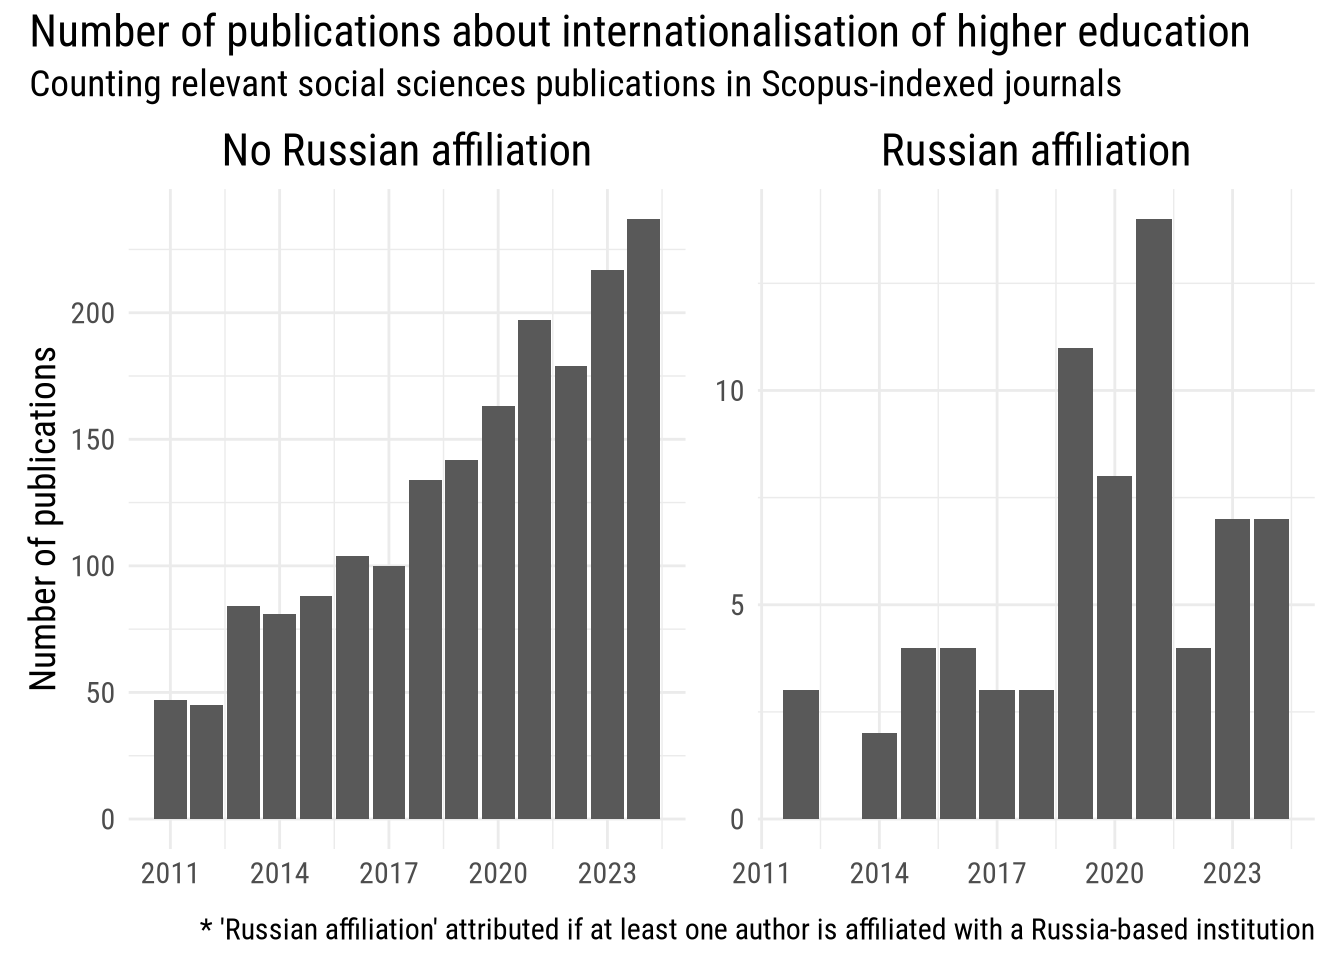
Two approaches for keeping only articles about internationalisation of higher education
Analysis based only on articles that explicitly refer to internationalisation of higher education (narrower criteria)
In order to capture only articles that explicitly focus on internationalisation of higher education, this section is based only on articles that match the following criteria:
- the full string “internationali(s|z)ation of higher education” is present in either title or abstract
- the author-provided keywords include both “higher education” and “internationali(s|z)ation”
This leads to a significantly reduced set of publications.
| Property | Value |
|---|---|
| Total publications | 1919 |
| Publications with Russia-affiliated authors | 70 |
Universities with most publications (narrower criteria)
| afid | Number of publications | Cited | affilname | affiliation-city | affiliation-country |
|---|---|---|---|---|---|
| 60016849 | 16 | 816 | University of Toronto | Toronto | Canada |
| 60017919 | 40 | 772 | The Education University of Hong Kong | Hong Kong | China |
| 60031117 | 13 | 733 | Boston College | Chestnut Hill | United States |
| 60010365 | 16 | 517 | The University of British Columbia | Vancouver | Canada |
| 60006541 | 28 | 463 | The University of Hong Kong | Hong Kong | Hong Kong |
| 60031004 | 11 | 427 | The University of Queensland | Brisbane | Australia |
| 60006242 | 17 | 378 | UCL Institute of Education | London | United Kingdom |
| 60031846 | 6 | 358 | University of South Australia | Adelaide | Australia |
| 60019578 | 13 | 352 | Monash University | Melbourne | Australia |
| 60005273 | 6 | 347 | Korea University | Seoul | South Korea |
| Affiliation | affiliation-city | Publications | Cited |
|---|---|---|---|
| HSE University | Moscow | 8 | 82 |
| RUDN University | Moscow | 5 | 34 |
| Ural Federal University | Yekaterinburg | 4 | 28 |
| Russian Presidential Academy of National Economy and Public Administration | Moscow | 4 | 26 |
| Moscow State Institute of International Relations (MGIMO) | Moscow | 5 | 23 |
| Far Eastern Federal University | Vladivostok | 2 | 23 |
| Plekhanov Russian University of Economics | Moscow | 2 | 20 |
| Siberian Federal University | Krasnoyarsk | 3 | 20 |
| Saint Petersburg State University | Saint Petersburg | 5 | 18 |
| University of Tyumen | Tyumen | 1 | 16 |
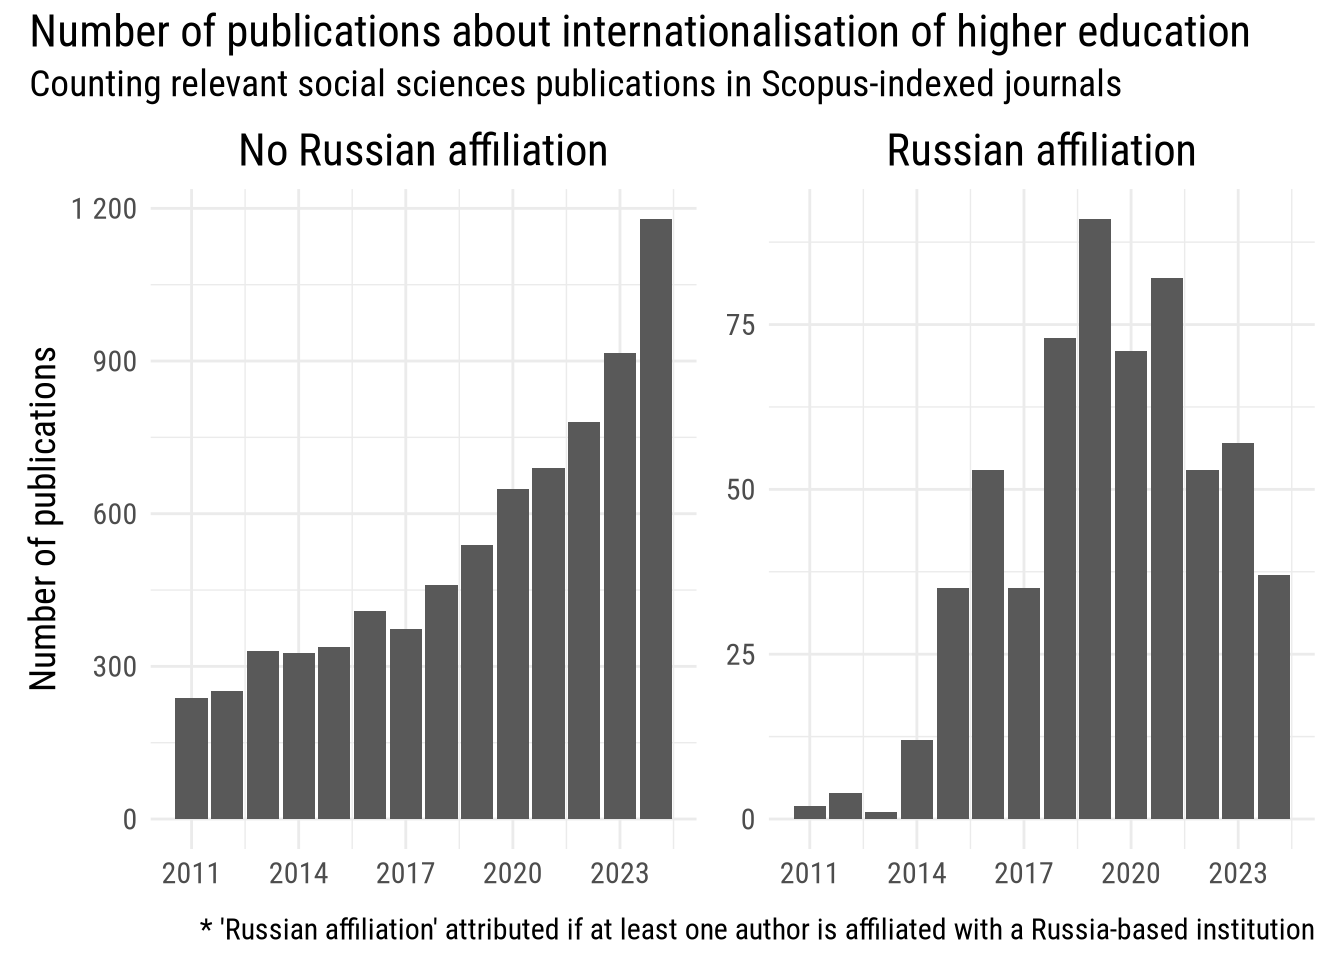
Include also articles that mention concepts that are contiguous to internationalisation of higher education (broader criteria)
Rather than keeping only articles that refer to “internationalisation of higer education”, the following section includes also articles that, besides “higher education”, also has one of the following keywords in either title, abstract, or author-given keywords. This list of keyword has been inductively derived from the most frequent terms that appeared in the abstracts meeting the narrower definition.
| keywords |
|---|
| internationalisation |
| internationalization |
| foreign students |
| foreign language |
| academic mobility |
| student mobility |
| international students |
| bologna process |
| international education |
| export of education |
| world-class universities |
| year | All | No Russian affiliation | Russian affiliation | Russian affiliation share |
|---|---|---|---|---|
| 2011 | 240 | 238 | 2 | 0.83% |
| 2012 | 255 | 251 | 4 | 1.57% |
| 2013 | 332 | 331 | 1 | 0.30% |
| 2014 | 339 | 327 | 12 | 3.54% |
| 2015 | 373 | 338 | 35 | 9.38% |
| 2016 | 462 | 409 | 53 | 11.47% |
| 2017 | 409 | 374 | 35 | 8.56% |
| 2018 | 532 | 459 | 73 | 13.72% |
| 2019 | 630 | 539 | 91 | 14.44% |
| 2020 | 720 | 649 | 71 | 9.86% |
| 2021 | 771 | 689 | 82 | 10.64% |
| 2022 | 833 | 780 | 53 | 6.36% |
| 2023 | 972 | 915 | 57 | 5.86% |
| 2024 | 1216 | 1179 | 37 | 3.04% |