The data you need to win the Olympics if you go NUTS
When everybody’s moved by the contagious joy of two athletes making history by agreeing to share an Olympic gold medal, the data analyst thinks: “two gold medals for the same competition? is this going to break my dashboard?”
"Can we have two gold? 🥇"
— Giuseppe Famà (@FamaNelMondo) August 1, 2021
"Let's make history, man"#GOLD #Tokyo2020 pic.twitter.com/y2PATi92Jq
In my case, I was worried it would break my parsing script. Fortunately, it didn’t, so after a quick check I could share their joy with relief. And then go back to wondering about the fairness of the Olympic medal table.
Armchair sports fans traditionally like to peddle with the Olympic medal table, asking themselves the customary questions… is it fair that the ranking is usually based on who gets the most gold medals? What if the ranking was instead based on some sort of weighted average of the medals? If - say - a gold medal is worth twice as much as a silver, and a silver twice as much as bronze, then would my favourite flag wave at the top of the ranking?
But just changing the value of medals brings you only so far, and the medal table may still look disagreeable. What else can be done to shake it up a bit further?
Being mildly annoyed by the excessive waving of national flags, I decided it would be nice to set up a medal table based on the number of medals won by regions, not by countries.
So… there we go.
Going NUTS, and beyond
How do we attribute a medal to a region? There’s no perfect approach, but place of birth of athletes should be meaningful enough in most cases. So all that is needed is find the place of birth of all medalists, geocode it, associate it with administrative entities of reasonable size, et… voilà!
So here’s how I went about it, considering that I wanted to have data unencumbered by copyright to share the fun.
- get all the Olympic medalist by country, sport, and event from the List of 2020 Summer Olympics medal winners available on Wikipedia
- parse all the tables on that page to extract the relevant information, including links to the Wikipedia page of each medalist (ultimately, this proved to be the most painful part)
- query the Wikipedia API to get the Wikidata ID of each medalist
- proceed in the much more data-friendly Wikidata, and get the place of birth of each medalist
- get from Wikidata the coordinates of the place of birth of each medalist
- match the coordinates to the administrative units where they are located. Data from Wikidata may have some inconsistencies due to different administrative subdivisions around the world, so on top of the ones included in Wikiata I did the geo-matching with NUTS regions - a standardised classification of administrative entities defined by the European Union (here’s a list of countries covered by NUTS, and here’s the geographic dataset for download)
- (optional) get from Wikidata all other sorts of data about the medalists or the place where they were born
The dataset
The resulting dataset is now available on GitHub. You can also check out the script used to retrieve the data.
How’s the quality of the dataset? Not too bad, in particular, for Europe, as the place of birth of most medalists is recorded in Wikidata. Globally, Wikidata has recorded the place of birth for about 80 per cent of medalists. It’s a good starting point.
The good news is that you can join the fun! :-)
Of course, you can contribute by adding to Wikidata the missing information, which is often available online.
And then… see who you can place at the top of the medal table by playing around with the data.
You can find the dataset, the code and all details about data parsing in this repository.
If you want to have a quick look at the data based on place of birth, why not head on to our online tool, latlon2map, that makes it easy to explore quickly all tabular data that have a longitude and latitude column. Upload the csv file there, set the right latitude and longitude columns, and you’re good to go.
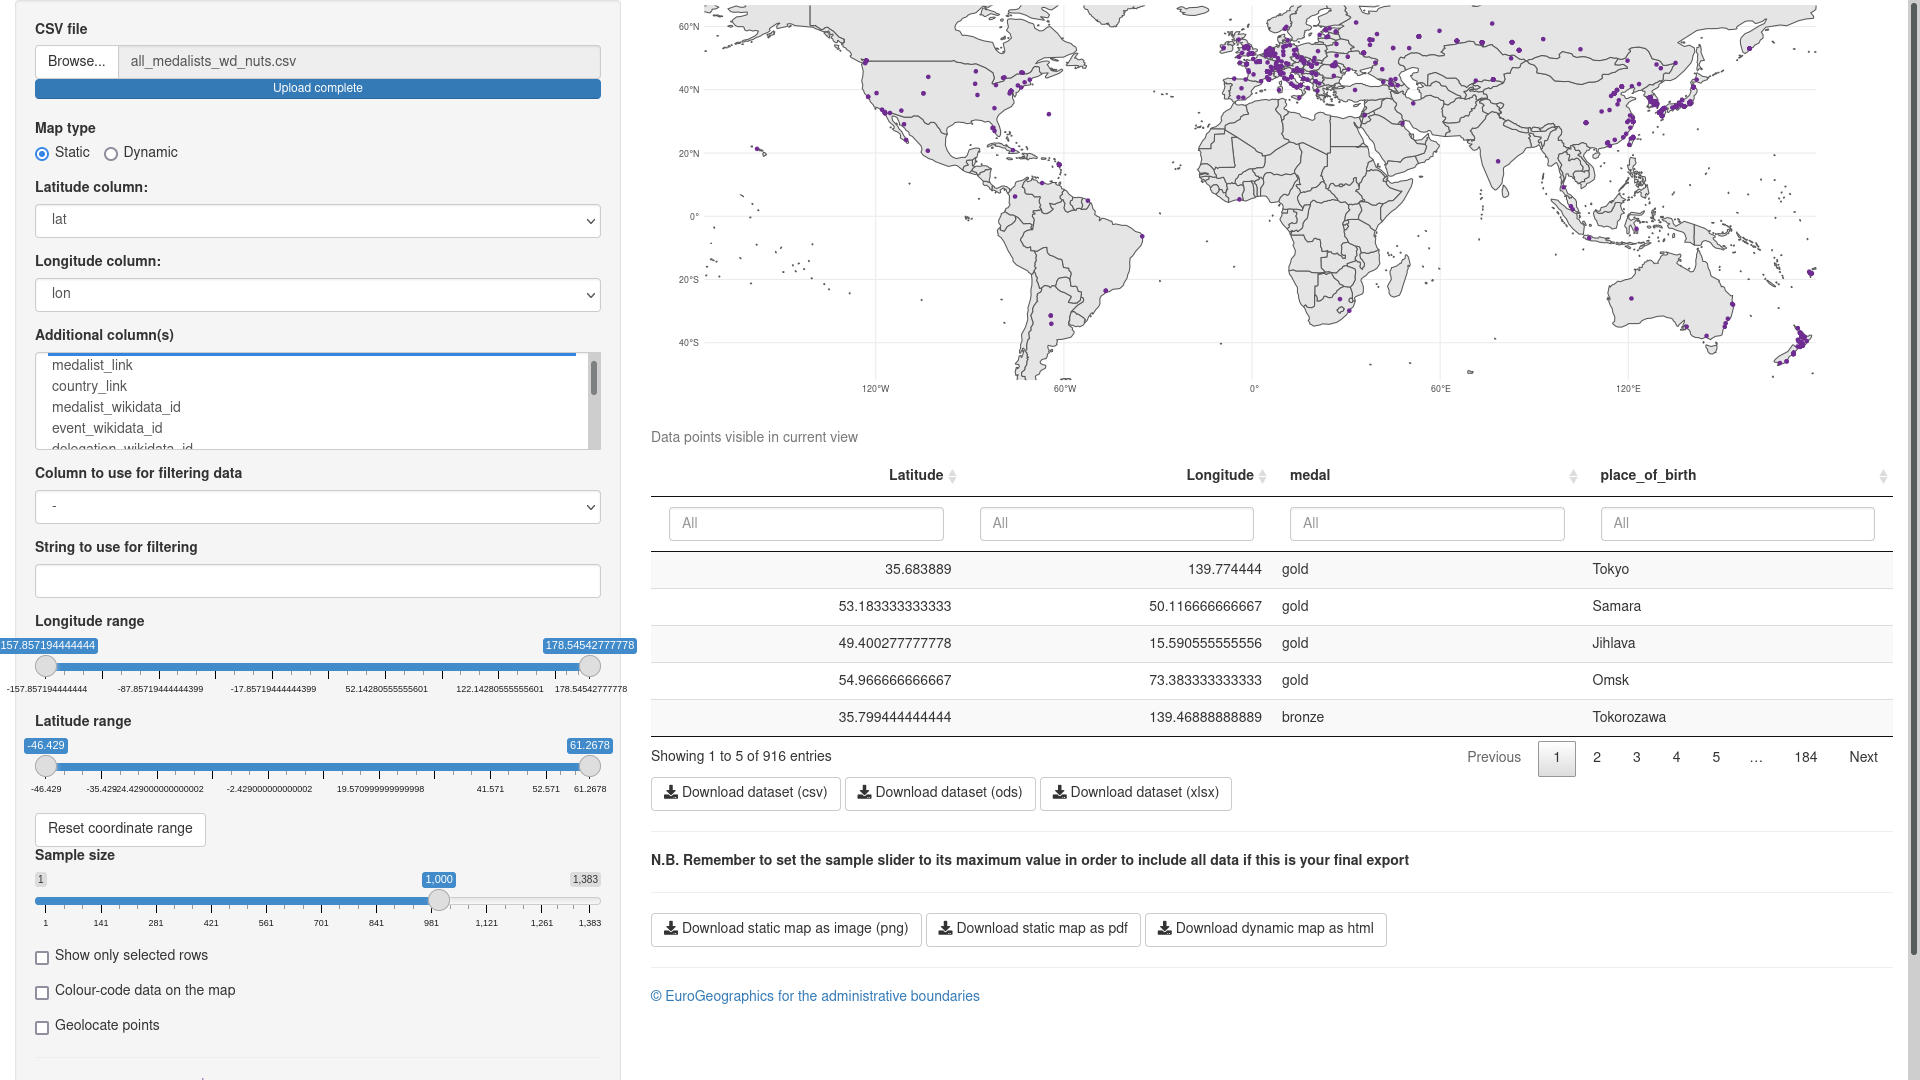
Screenshot of the web interface of latlon2map
As for me, tired with all the data processing, I took a lazy if controversial approach. I decided that I will count each medal and each medalist the same. Bronze and gold look just as shiny to me. The official table counts just one medal for a team win, but I think that each piece of metal is a piece of joy for the person who brings it home: if eight people row together to get a medal and each can place a medal around their neck, then that’s eight medals for me. And then… let’s see how things go by focusing only on NUTS regions in Europe.
So… here’s my medal table for NUTS2:
| NUTS 2 | Country | Total medals |
|---|---|---|
| Ile-de-France | France | 23 |
| Lombardia | Italy | 13 |
| Rhône-Alpes | France | 10 |
| Greater Manchester | United Kingdom | 9 |
| Nord-Est | Romania | 8 |
| Budapest | Hungary | 7 |
| West Central Scotland | United Kingdom | 7 |
| Düsseldorf | Germany | 6 |
| Zuid-Holland | Netherlands | 6 |
| Campania | Italy | 5 |
| Jadranska Hrvatska | Croatia | 5 |
| Jihovýchod | Czechia | 5 |
| Provence-Alpes-Côte d’Azur | France | 5 |
| West Yorkshire | United Kingdom | 5 |
| Beogradski region | Serbia | 4 |
| Berlin | Germany | 4 |
| Bretagne | France | 4 |
| Eesti | Estonia | 4 |
| Guadeloupe | France | 4 |
| Kontinentalna Hrvatska | Croatia | 4 |
So what sport is it that folks in Ile-de-France are so good at? Mostly judo and fencing, it appears.
| Sport | Total medals |
|---|---|
| judo | 10 |
| fencing | 5 |
| rugby | 2 |
| triathlon | 2 |
| equestrian sport | 1 |
| rowing | 1 |
| shooting sport | 1 |
| track cycling | 1 |
And what if we adjust by population… would the ranking change significantly?
| NUTS 2 | Total medals | Country | Population | Medals per million residents |
|---|---|---|---|---|
| Guadeloupe | 4 | France | 412 682 | 9.69 |
| West Central Scotland | 7 | United Kingdom | 1 541 998 | 4.54 |
| Budapest | 7 | Hungary | 1 750 216 | 4.00 |
| Dytiki Makedonia | 1 | Greece | 264 670 | 3.78 |
| Zentralschweiz | 3 | Switzerland | 818 962 | 3.66 |
| Jadranska Hrvatska | 5 | Croatia | 1 373 802 | 3.64 |
| Guyane | 1 | France | 288 086 | 3.47 |
| Overijssel | 4 | Netherlands | 1 162 406 | 3.44 |
| Molise | 1 | Italy | 300 516 | 3.33 |
| Cheshire | 3 | United Kingdom | 931 347 | 3.22 |
| Greater Manchester | 9 | United Kingdom | 2 822 003 | 3.19 |
| Friesland (NL) | 2 | Netherlands | 649 957 | 3.08 |
| Eesti | 4 | Estonia | 1 328 976 | 3.01 |
| Ipeiros | 1 | Greece | 333 265 | 3.00 |
| Jihovýchod | 5 | Czechia | 1 701 802 | 2.94 |
| Ticino | 1 | Switzerland | 351 491 | 2.85 |
| Martinique | 1 | France | 359 821 | 2.78 |
| Ostschweiz | 3 | Switzerland | 1 183 813 | 2.53 |
| Nord-Est | 8 | Romania | 3 184 215 | 2.51 |
| Sjælland | 2 | Denmark | 837 359 | 2.39 |
I like this one. I like lazy summer afternoons.
If you want to play around with this dataset or expand on it, you can download it as a .csv file from this repository, where you find also a detailed description of the procedure used to generate it.
P.S. The data in this post have been last updated on: 2021-08-03 15:14:28.