How to find the population-weighted centre of local administrative units
Originally published by EDJNet
Preliminary note: All code for this post is available at this link. Various operations described in these posts were facilitated by a new R package, latlon2map; the package has already a basic vignette, with the title “Removing the boring parts from geocomputation with European data”.
For a number of data visualisations and data analysis it is useful to have the coordinates of the centre of a town or municipality. In a lengthy post (in Italian), Andrea Borruso highlighted why this can be useful, pointed at a number of alternative solutions, and to some of their shortcomings. In his case, he needed to determine the starting point of lines used to visualise on a map the number of commuters moving between municipalities.
More recently, my colleague Ornaldo Gjergij needed it to determine which data point to use to report change of temperature since the 1960s in a given municipality based on Copernicus data. In his case, the solution had to be scalable across Europe and offer consistently meaningful results in the vast majority of cases.
The problem
In principle, this looks like a reasonably straightforward problem. Eurostat conveniently distributes geographic data on all local administrative units in Europe. The easy solution is to let software calculate the centroid for each of them, and presto, mission accomplished.
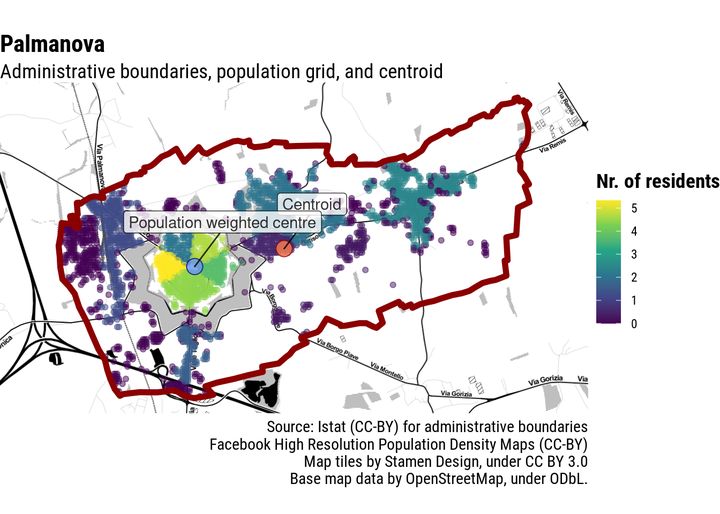
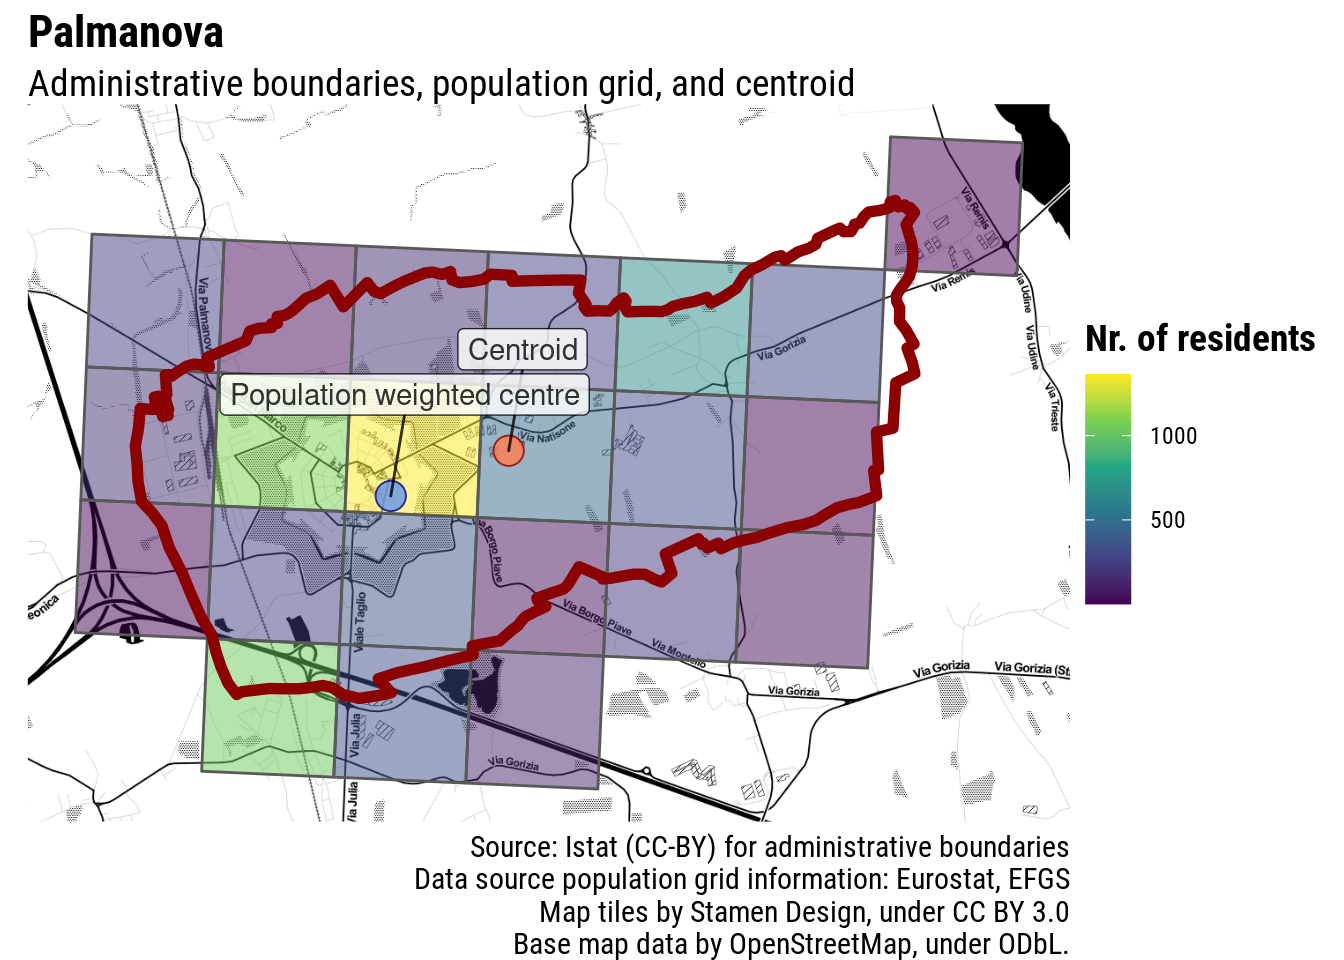
This would be alright if all municipalities were roundly shaped. Unfortunately, this is rarely the case. Even towns which are as satisfyingly regularly-shaped as possible, often have irregular administrative boundaries. Palmanova, in Italy, has an unmistakable centre, but the administrative boundaries of its municipality are not as regularly shaped: the centroid of those boundaries clearly does not correspond to the town centre.
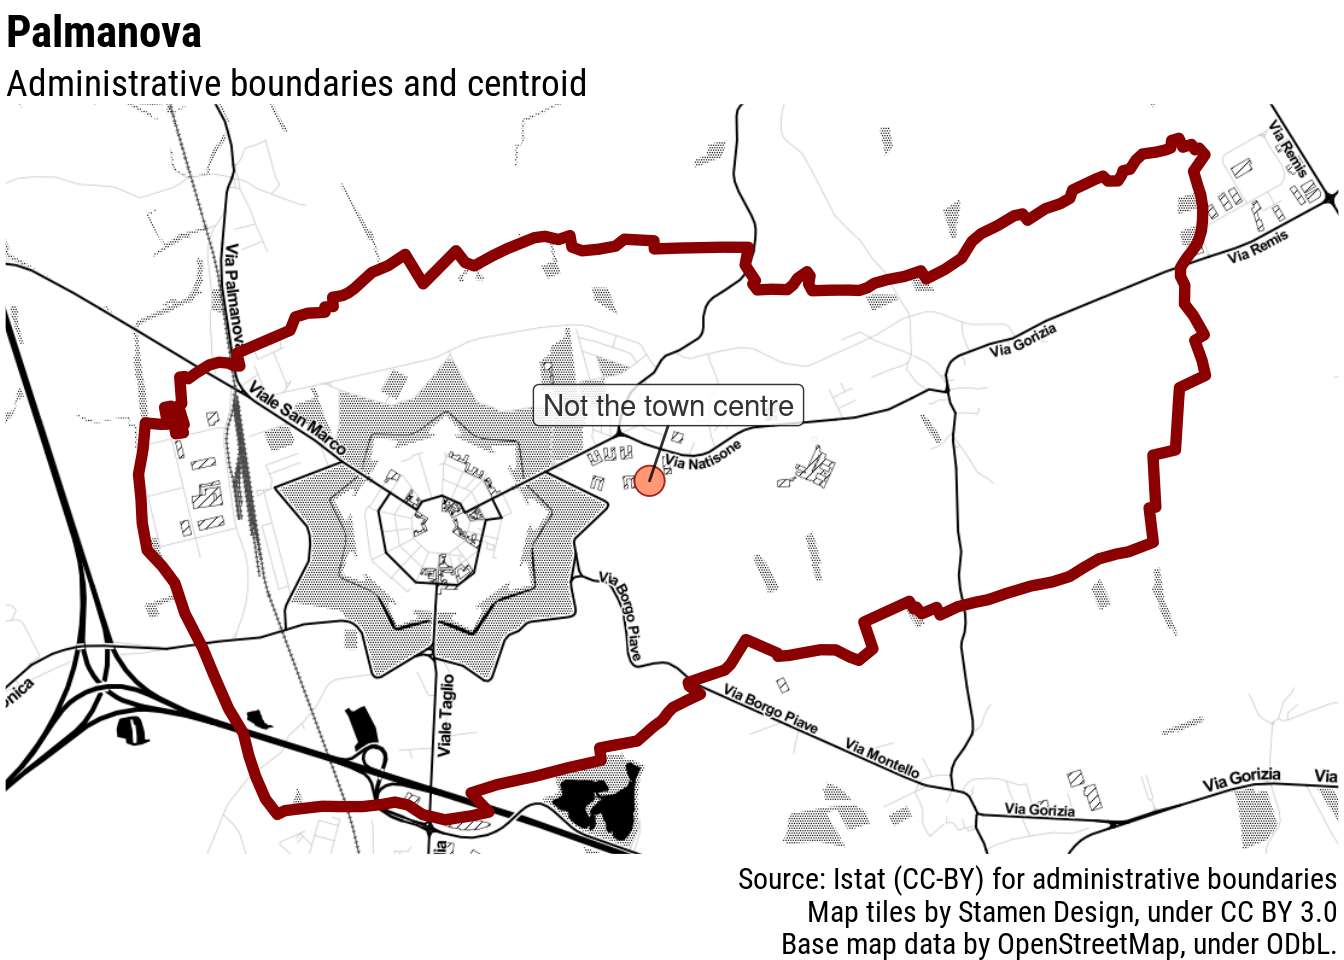
In many cases, the difference is hardly noticeable especially if the zoom on the map is not too close. However, there is a full range of more complicated and not so uncommon cases.
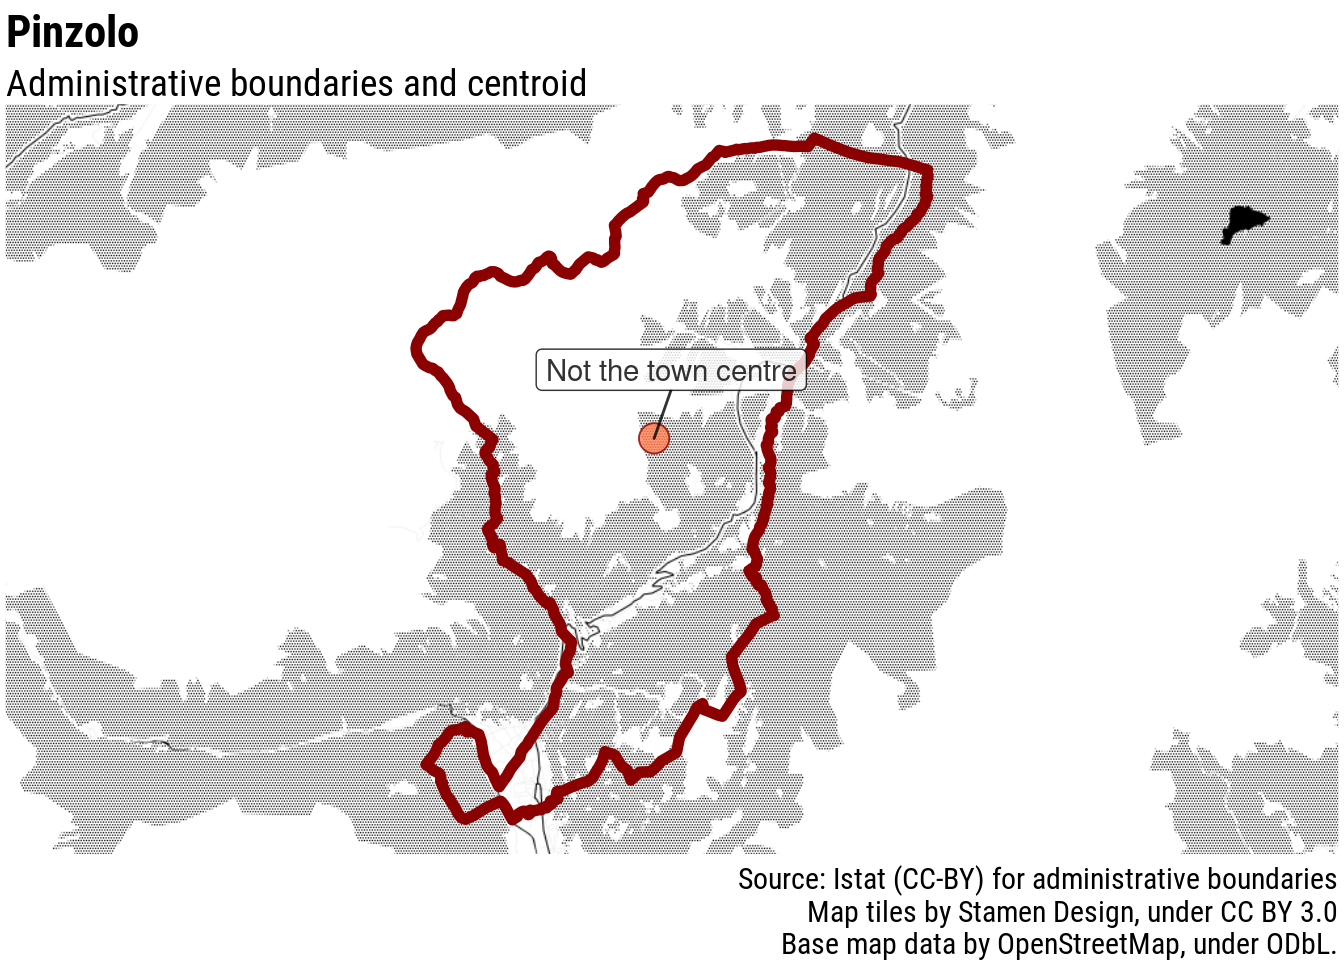
In the European context, things get more complicated and problematic in particular with island archipelagos (obviously), sparsely populated areas, and mountain regions where large uninhabited areas are by necessity attributed to a given municipality: the inhabited centre of the municipality is often at the margins of the administrative boundaries.
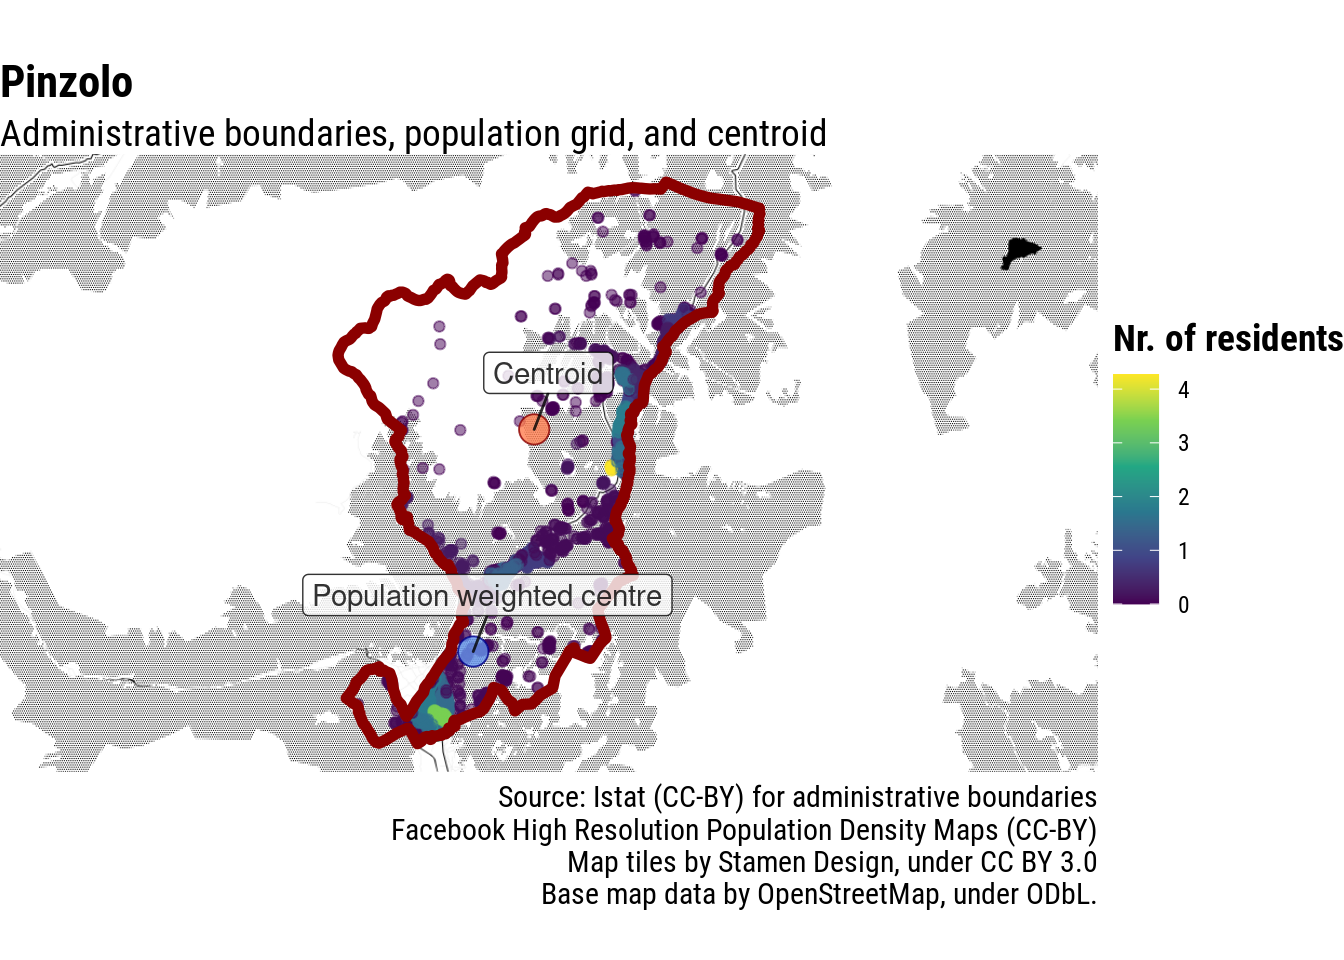
In the case of Pinzolo, for example, in Italian Alps, the centre of the municipality is at the utmost South of its administrative boundaries.
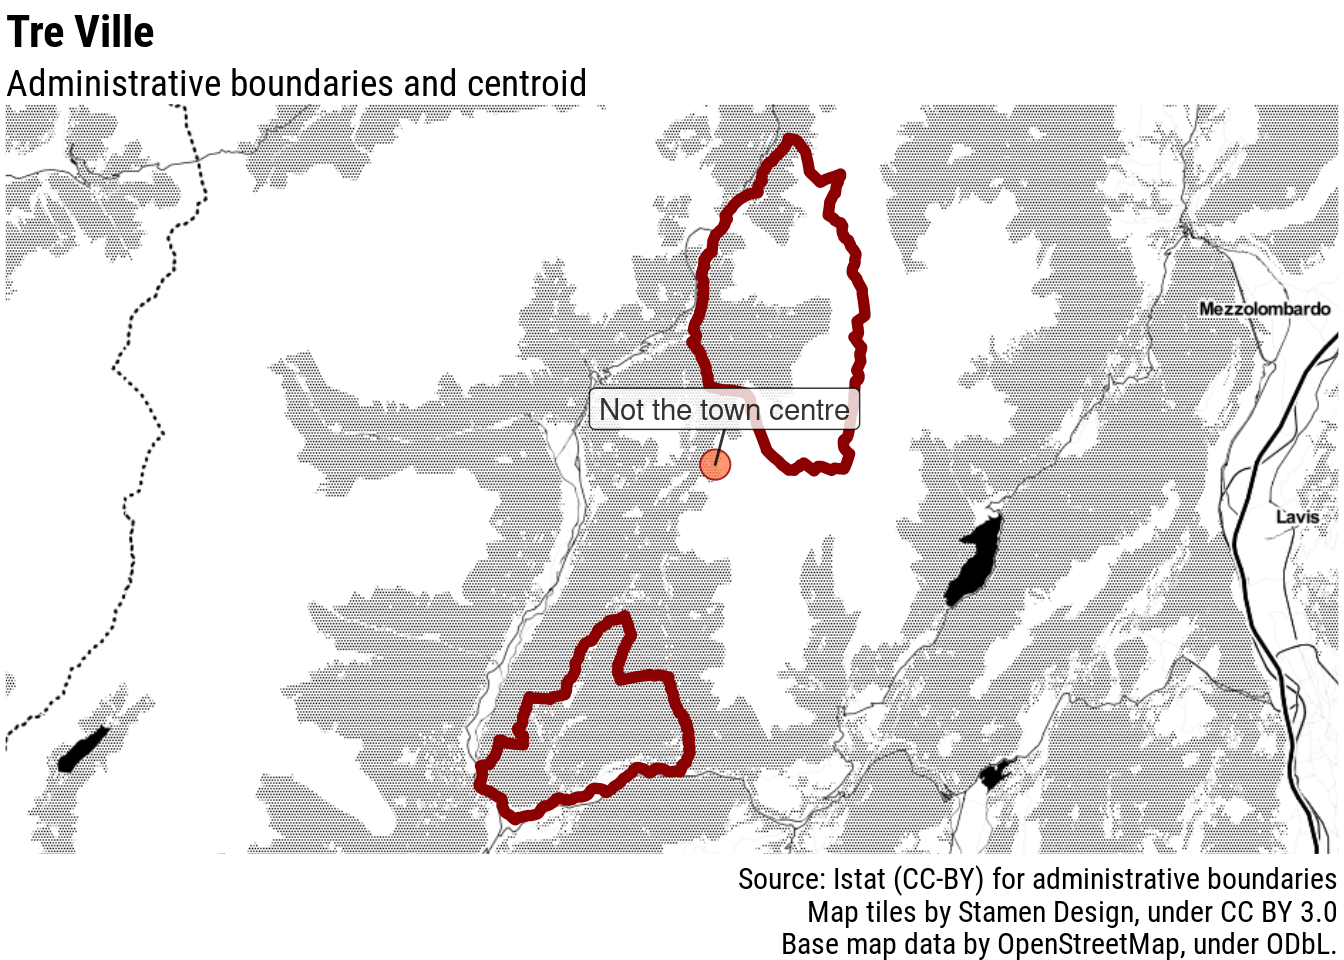
Besides, it is not uncommon for mountain municipalities to have non-contiguous territory, as mountain pastures and forests were attributed to different communities. In some cases, the non-inhabited part of the municipality in the mountains has a larger surface than the inhabited part, making it problematic to apply the easy solution of picking the centroid of the largest contiguous area: it would just pick a spot close to some mountain peak. This is the case, for example, of Tre Ville, not far from Pinzolo.
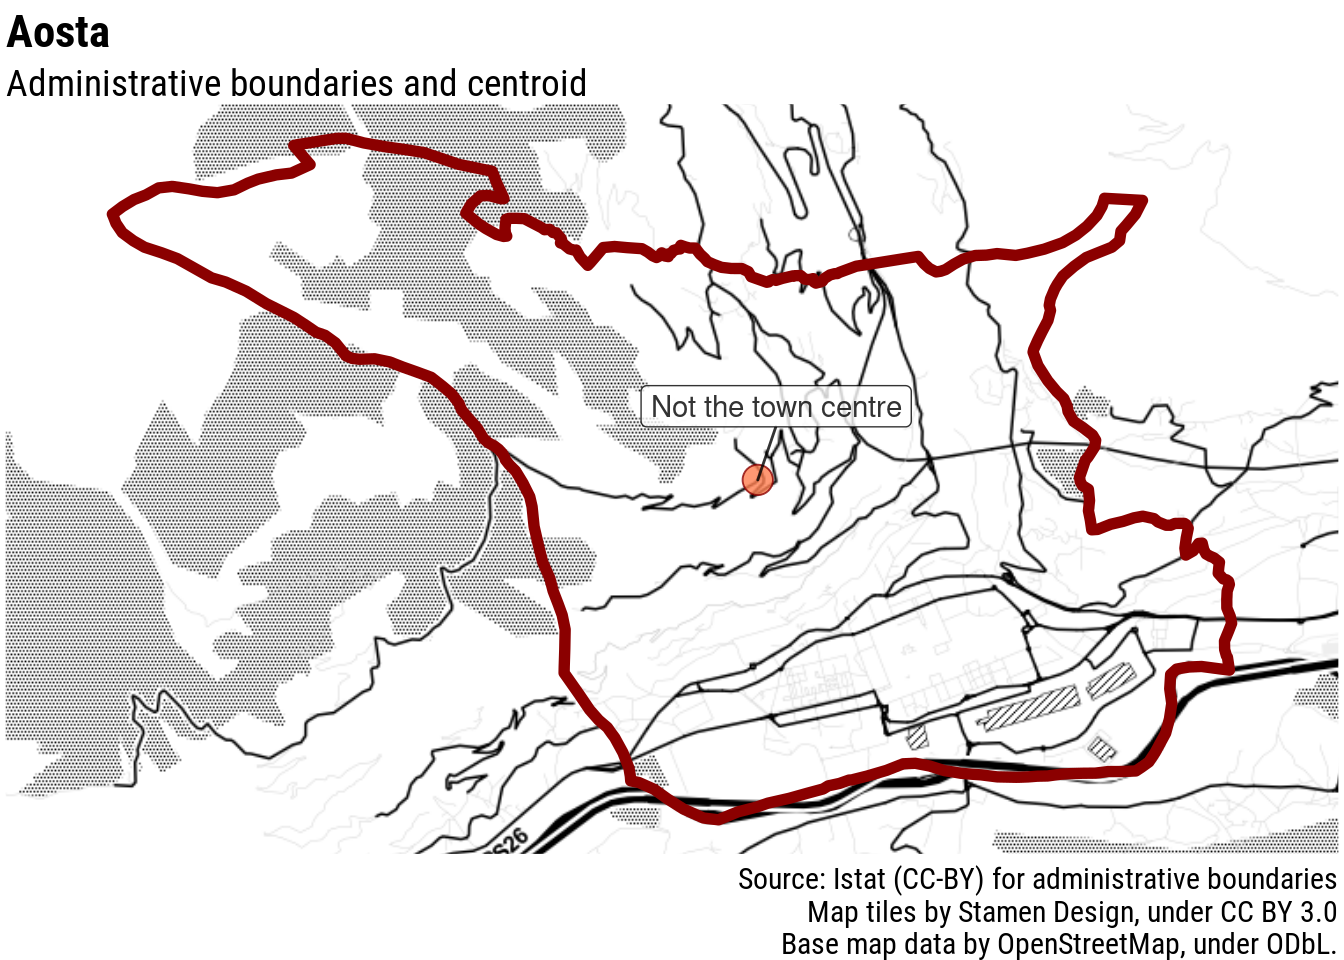
In the case of island archipelagos, this approach would likely just pick a spot in the middle of the sea. This is not an issue only of tiny villages, but also for regional centres, such as Aosta, in Italy’s North-West.
Why is this a problem?
In the case outlined by Andrea Borruso in the post linked above, the problem is that the visuals are unconvincing to local residents if they do not reflect the actual human geography that they are familiar with.
In the case of my colleague Ornaldo, defining where a given town actually is has an impact on the data themselves. You can find more details about his work at this link, but here is his problem in brief. One of the datasets distributed by Copernicus provides detailed data on temperature for the whole period 1961-2018, with data available for a grid covering all of Europe with a precision of 5.5 km. These data are continuous and know no borders, but change of temperature differs considerably even in contiguous grid cells, in particular in mountain or seaside areas: readers familiar with the geography of Italy, for example, will surely understand that a large number of municipalities falls into one of these two categories.
In order to make these data available to the wider public, Ornaldo created an interactive interface enabling readers to find data about their own town (currently available for Italy [link], forthcoming for the rest of Europe). Here is the problem: when talking about the temperature of Aosta, people will have in mind the city of Aosta. For example, when they look at the weather forecast, they see the expected temperature of downtown Aosta, not the one on the neighbouring mountaintop, which would be very different and not really helpful in understanding if they need a coat or not to go out. As a consequence, when reporting temperature change of Aosta, if we want to be fair to the reader, we should give the temperature change in the city of Aosta, not on some mountain in its proximity. This is true also for small municipalities in the mountains, especially if we publish these data with a local audience in mind.
Ultimately, this is relevant also for national audiences, considering that such mountain locations are often outliers and as such are more likely to make headlines: to the extent that it is possible, such headline should make sense, and not simply record whatever municipality happens to have more mountain pastures and peaks within its administrative boundaries.
The solution: towns are where people are
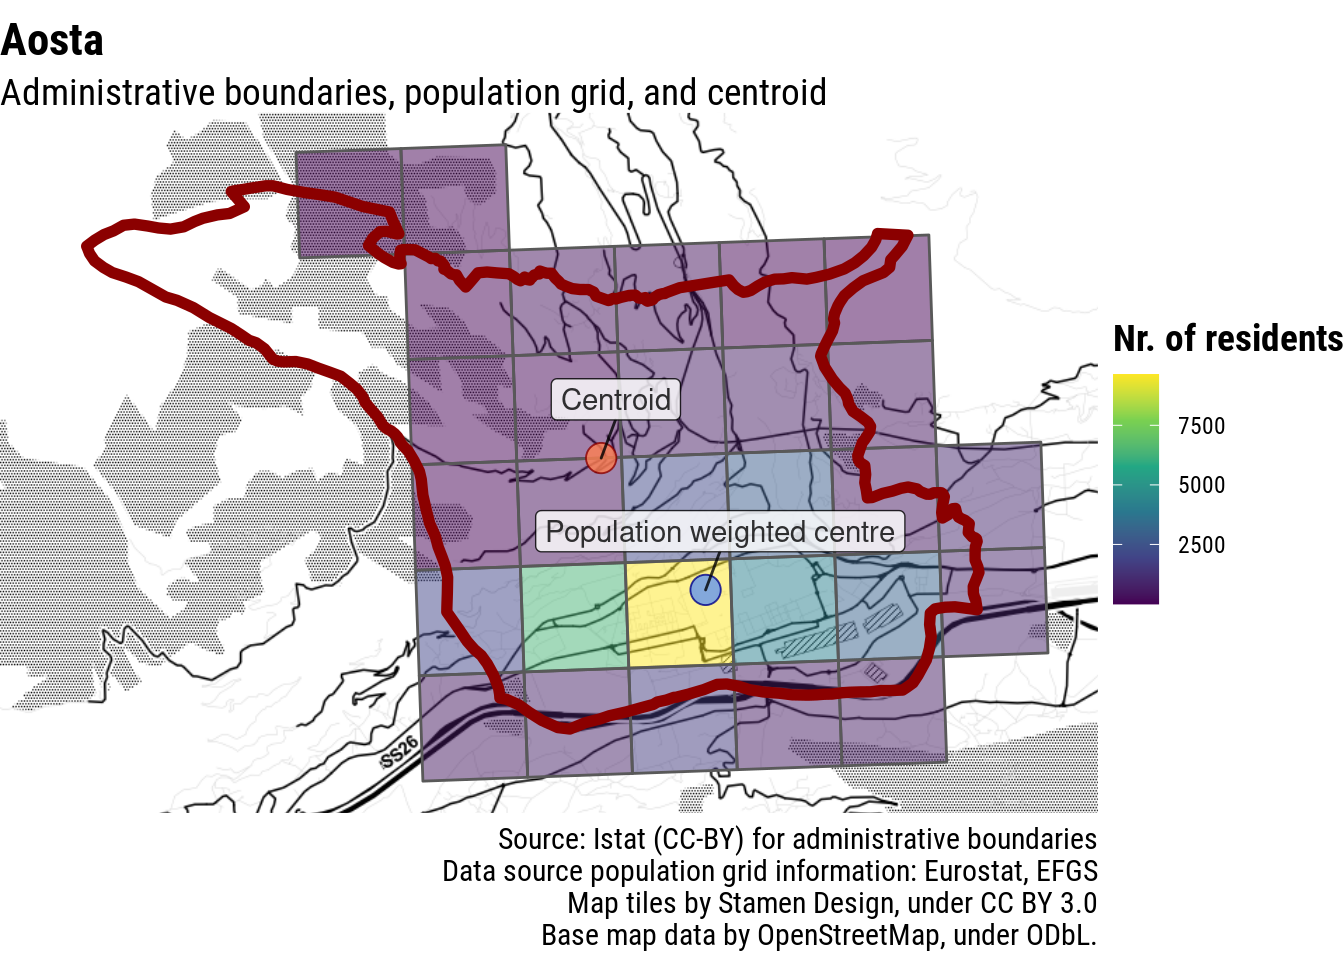
Ultimately, towns are where people are. So the best way to find the centre of a municipality could well be to find the population-weighted centre. Given that Eurostat distributes a population grid with data on the number of residents in each square kilometer of the continent, it should be possible to consistently apply this approach for all municipalities in the European Union.
How does this look in practice? Let’s start from an easy case: a relatively big town with large non-inhabited areas within its municipal border. If the town centre is where people are, and through the population grid we know where people live, we can just make a weighted average of the coordinates of the centroids of each cell of the population grid. Et voilà, we have a point that can reasonably be understood as a central location of the town.
Let’s move on to more complicated scenarios, e.g. a municipality that has its centre close to its administrative boundaries. A weighted average performs better than the centroid, but sets a point that is still far from where most people live.
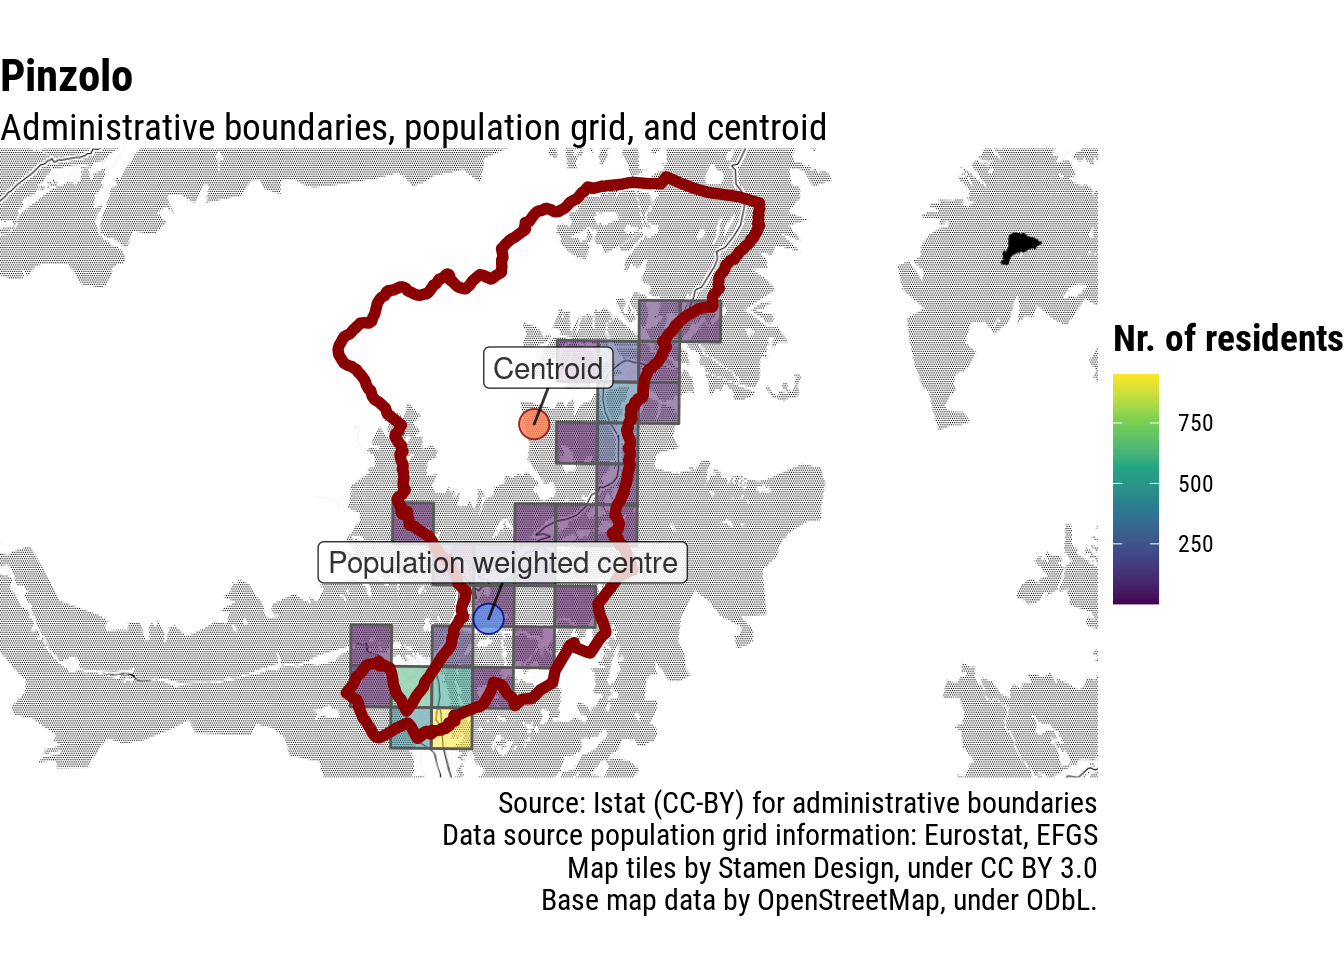
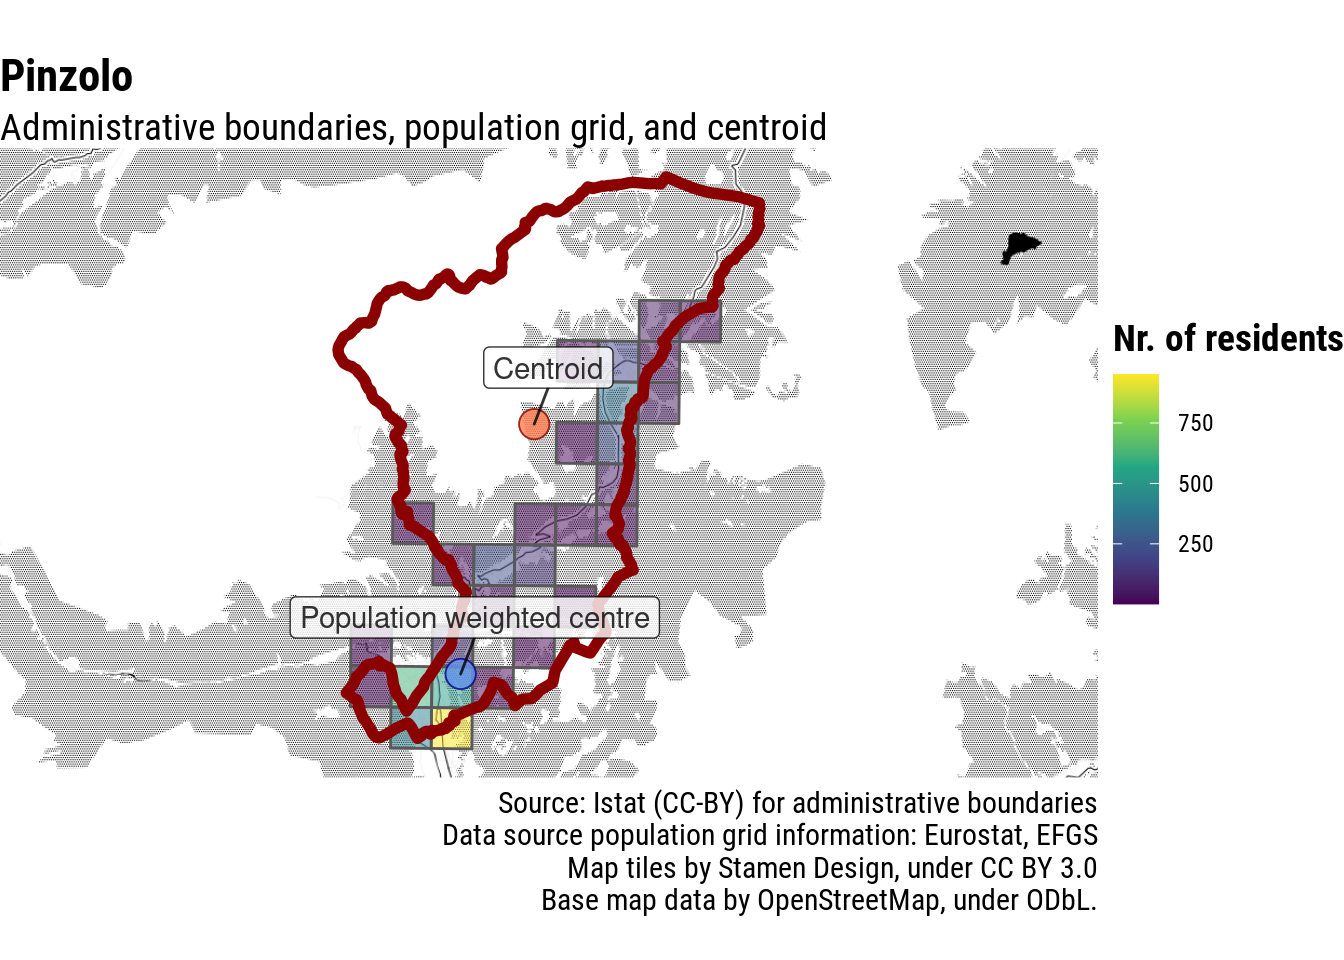
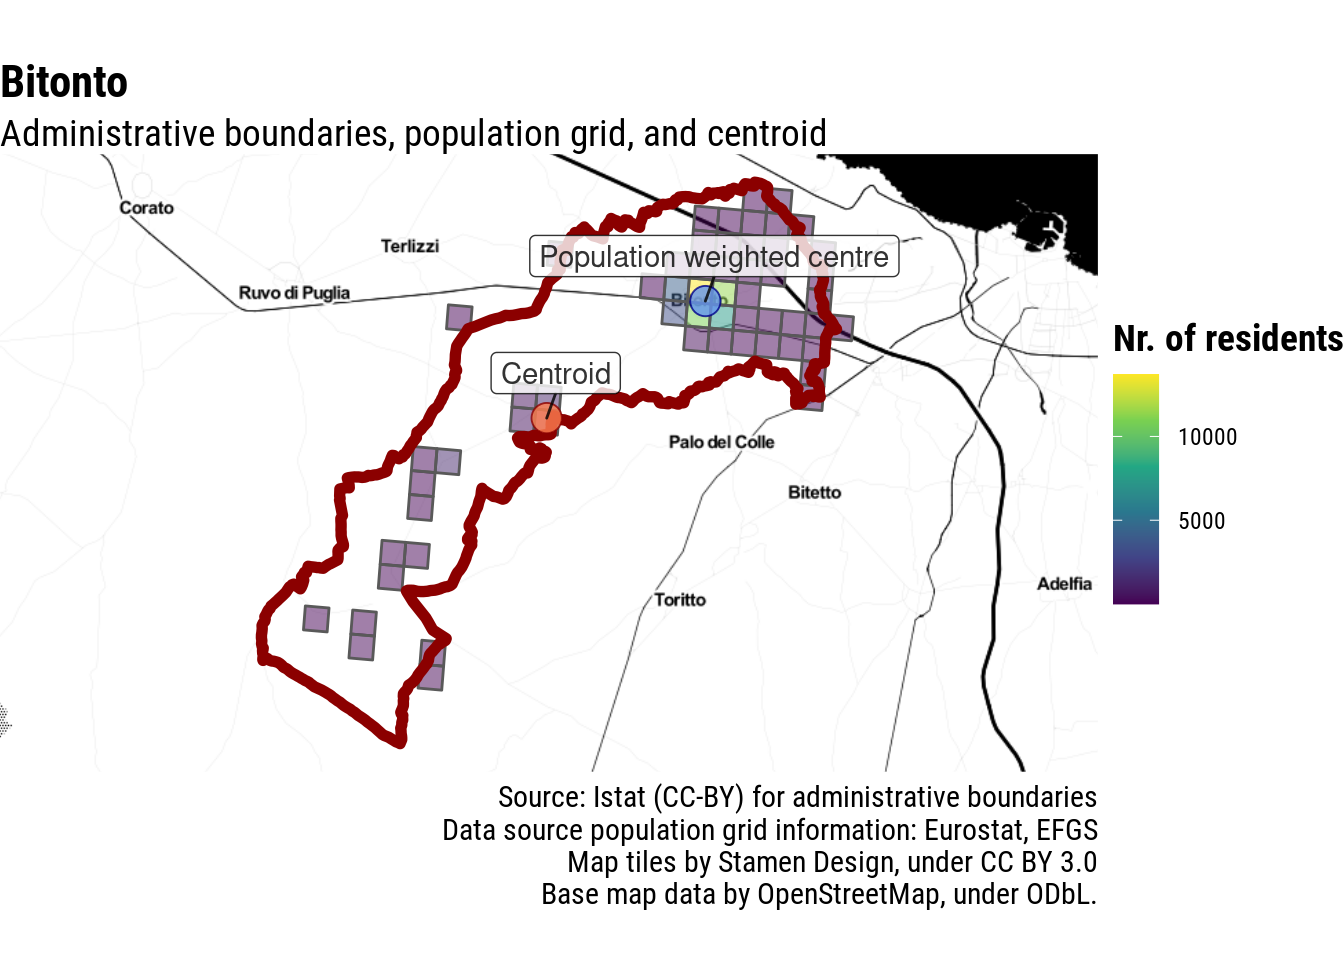
Since we are interested in locations where most people live, it probably makes sense to give much more proportional weight to cells where a lot of people live. So let’s raise population per cell to the power of 2 to give disproportionate weight to highly inhabited locations. Much better.
This works well also with one of the cases mentioned by Andrea Borruso in his post, Bitonto, in Puglia.
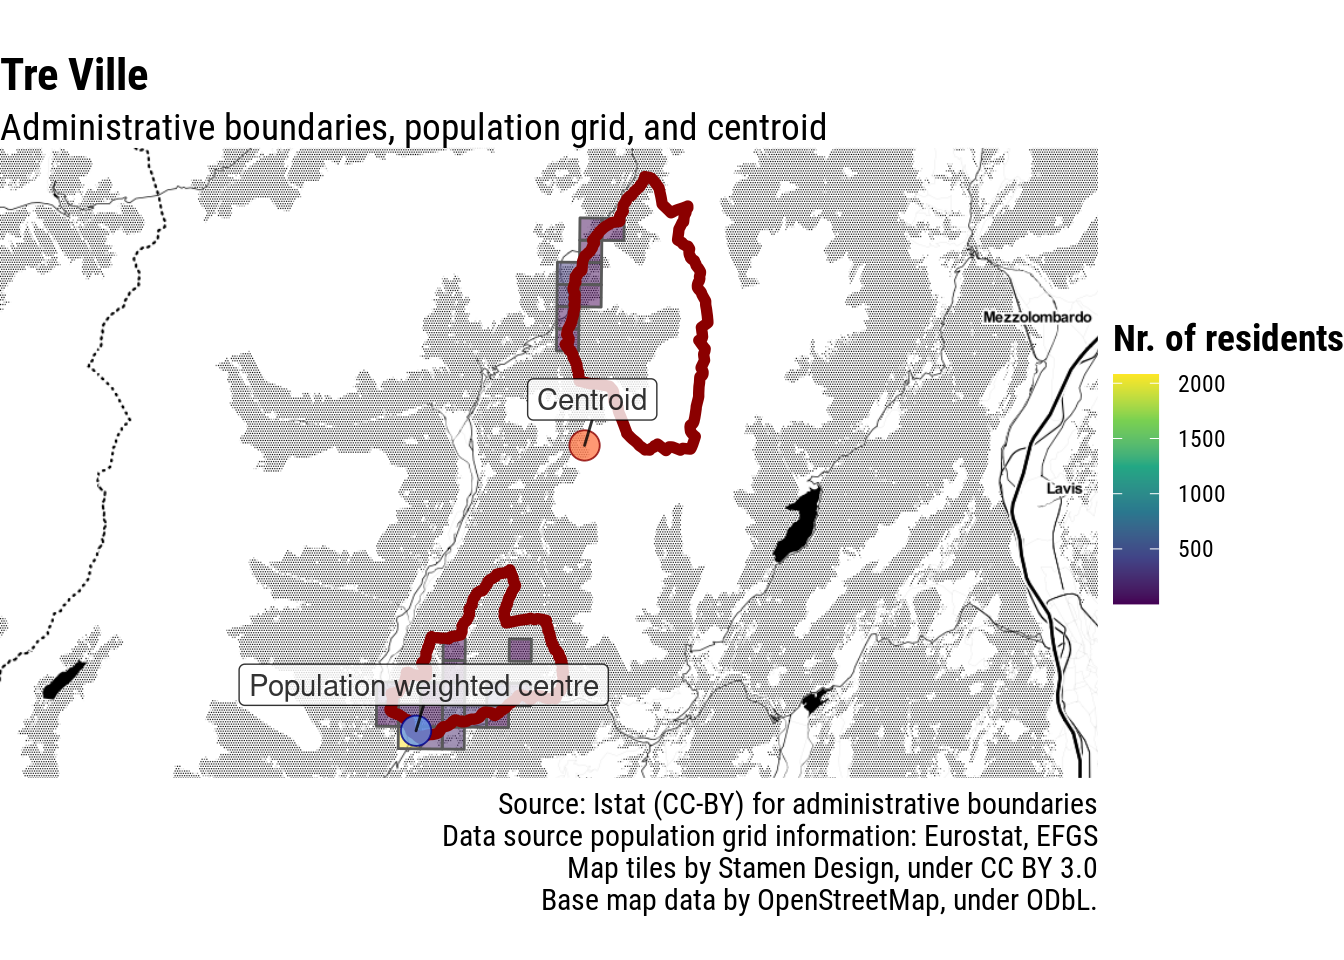
Let’s move on to more complicated scenarios: municipalities with non-contiguous territory. Having the centre outside of the borders is obviously not ideal. The most straightforward solution would be to pick the centroid of the part with the largest area, but in this case, for example, this would not work. In most cases, the better solution is probably to calculate the population-weighted centre of the most populous contiguous area, and then add a check to ensure that the final point actually falls into the administrative borders.
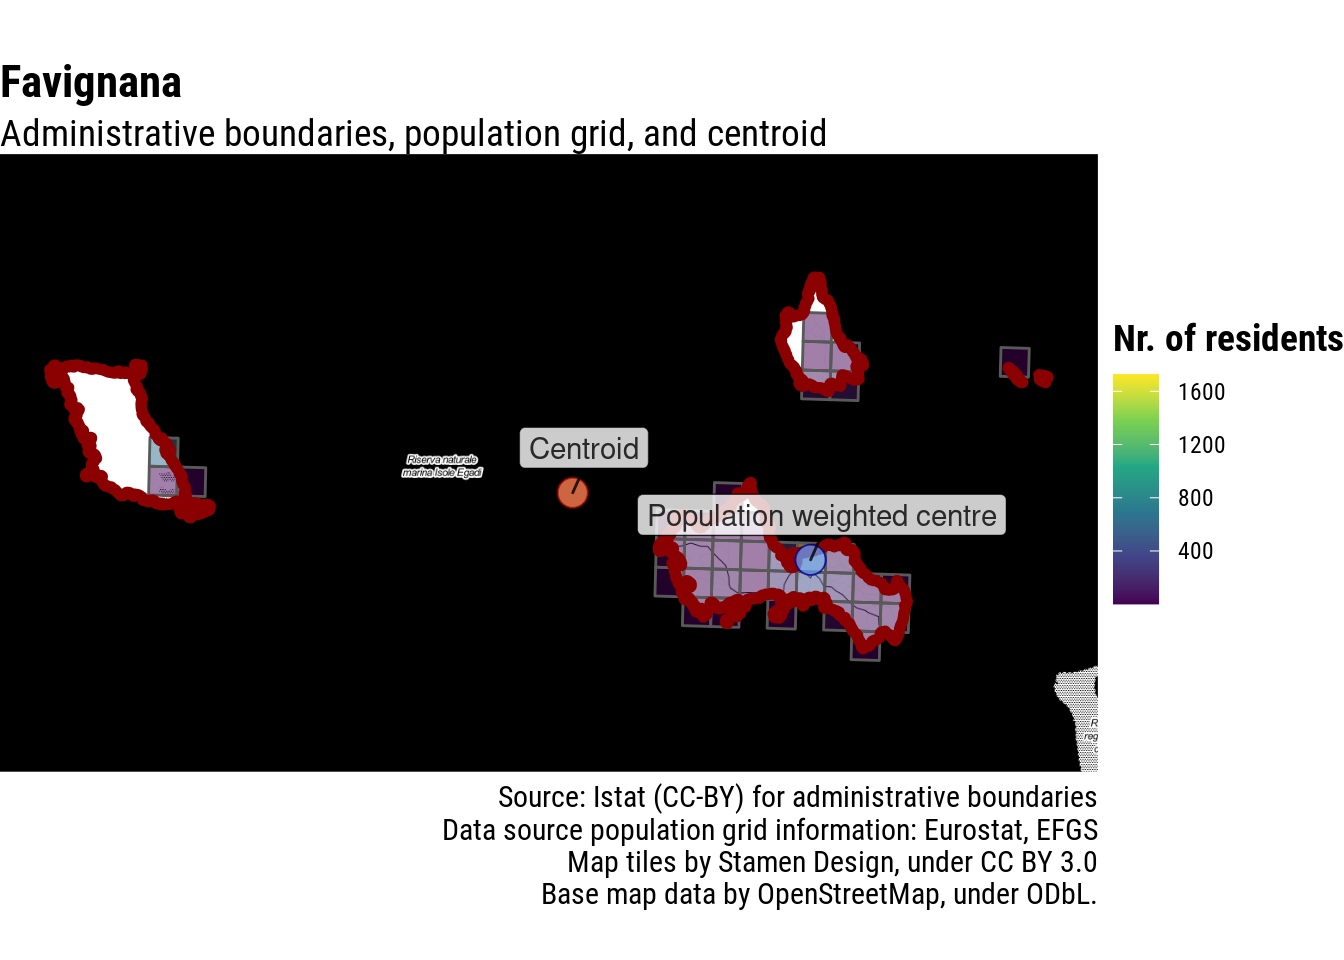
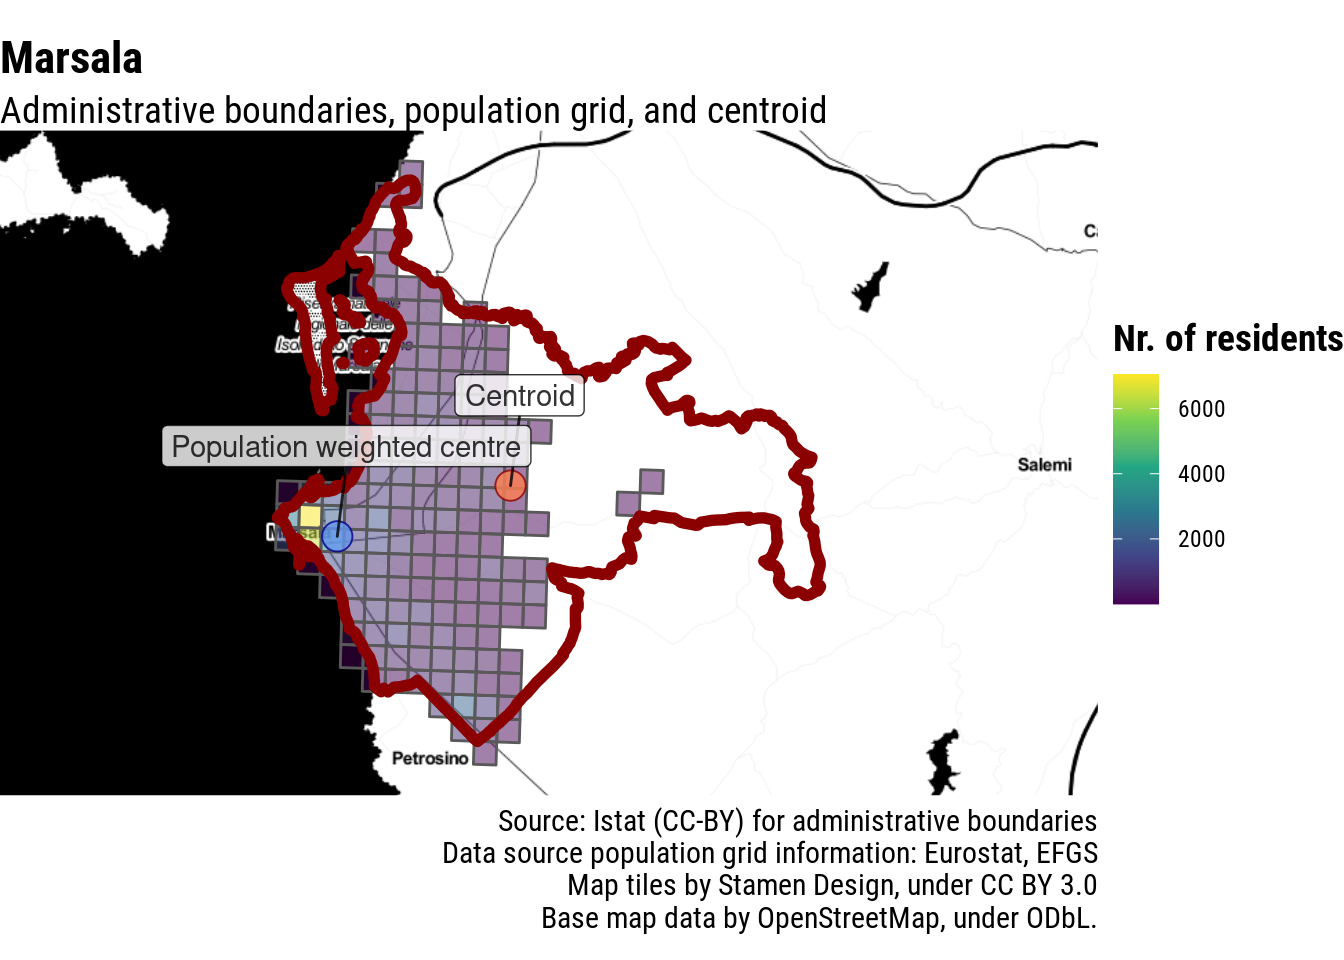
Again, this gives a meaningful answer also for some of the island and coastal municipalities mentioned in Borruso’s post.
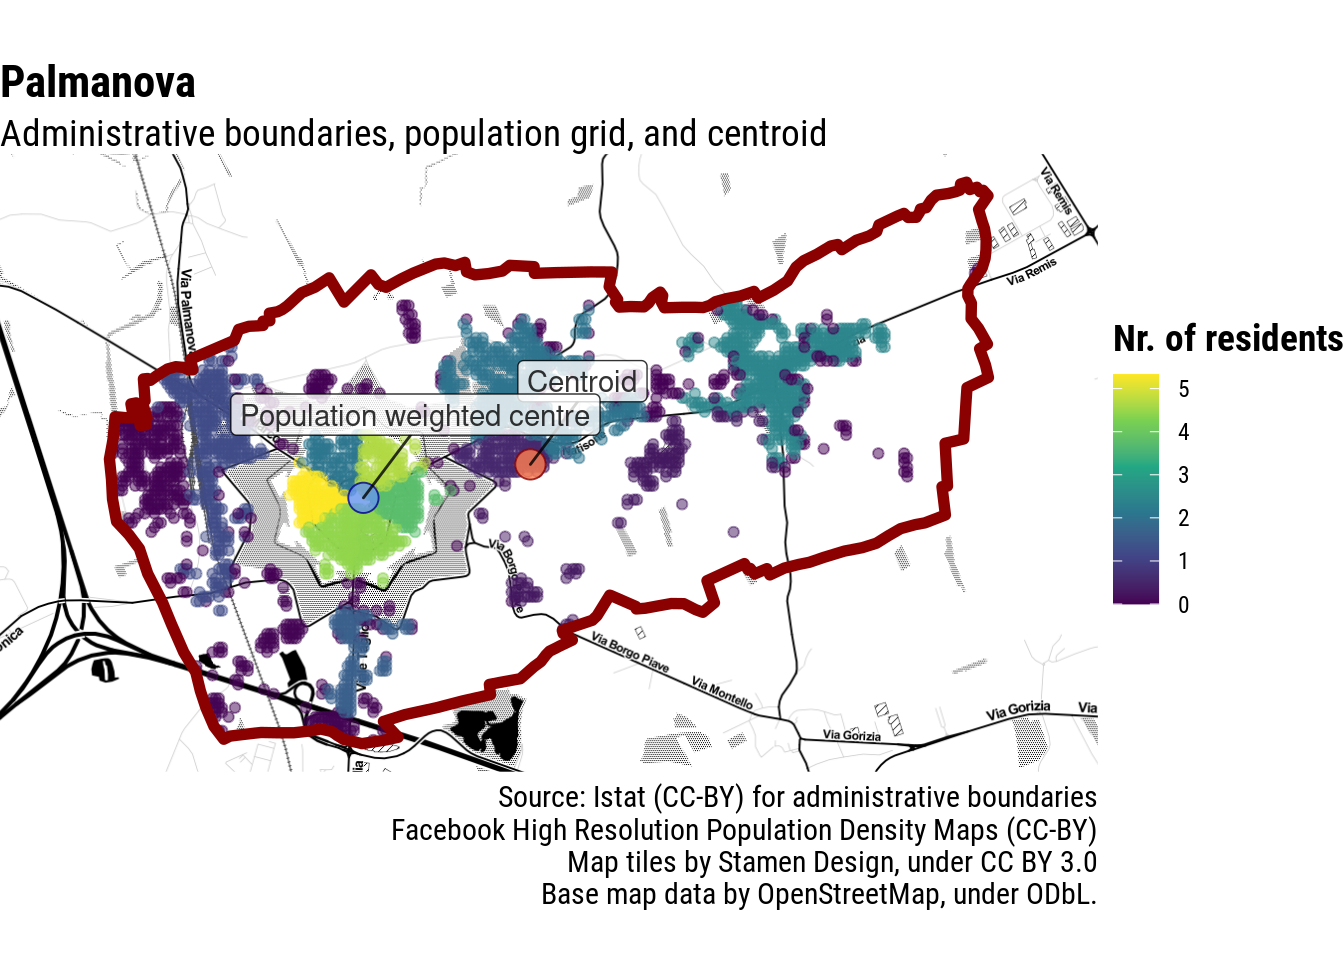
Even in Palmanova the population-weighted centre falls reasonably close to where we would expect it to be. I would not win a darts tournament with this shot, but it definitely would not be a miss.
All local administrative units, all of the EU?
Sure, why not? You can download the resulting datasets with the coordinates of the centre of municipalities of local administrative units calculated as detailed in this post from this link [coming soon-ish: on my laptop, it should take a couple of days to process the more than 100.000 local administrative units included in the dataset].
Is this it?
This solution is not going to work in all cases. Including in the calculation grid cells that are not completely inside the administrative boundaries of a given municipality is necessary (some municipalities are very small, and as appears from the example above some have most of its residents at the margins), but may also lead to include in the calculation residents from neighbouring areas.
Again, in his post Andrea Borruso mentions a number of alternative approaches. Looking for the town centres as defined in OpenStreetMap may actually give better results in most cases. But the approach outlined in this post is more flexible, and could be used to find the centre of other territorial units, such as electoral precincts or census areas.
This approach could be further improved by having more detailed data. And as it turns out, they exist. Facebook (yes, Facebook) distributes with a permissive Creative Commons license high resolution population maps: “these high-resolution maps estimate the number of people living within 30-meter grid tiles in nearly every country around the world.” The full methodology is detailed on their website, but in brief, they take available data and adjust them using satellite imagery and machine learning. As of this writing, these population grids have last been updated in March 2020, with most recent data referring to 2019. They can be downloaded freely, yet they seem to be little used, with their own download stats recording only a few dozen hits per month for most country-level data.
Using such granular data, do we get more accurate centres?
Apparently, not always: in the case of Pinzolo, Facebook’s machine learning based on satellite imagery seemingly mistaked facilities for ski-goers with residential housing, moving the population-weighted centre further away from the actual village.
Further increasing the disbalance in favour of highly populated areas, by raising the residents of each cell by the power of 5, reduces the impact of such (probably uncommon) distortions in the data.
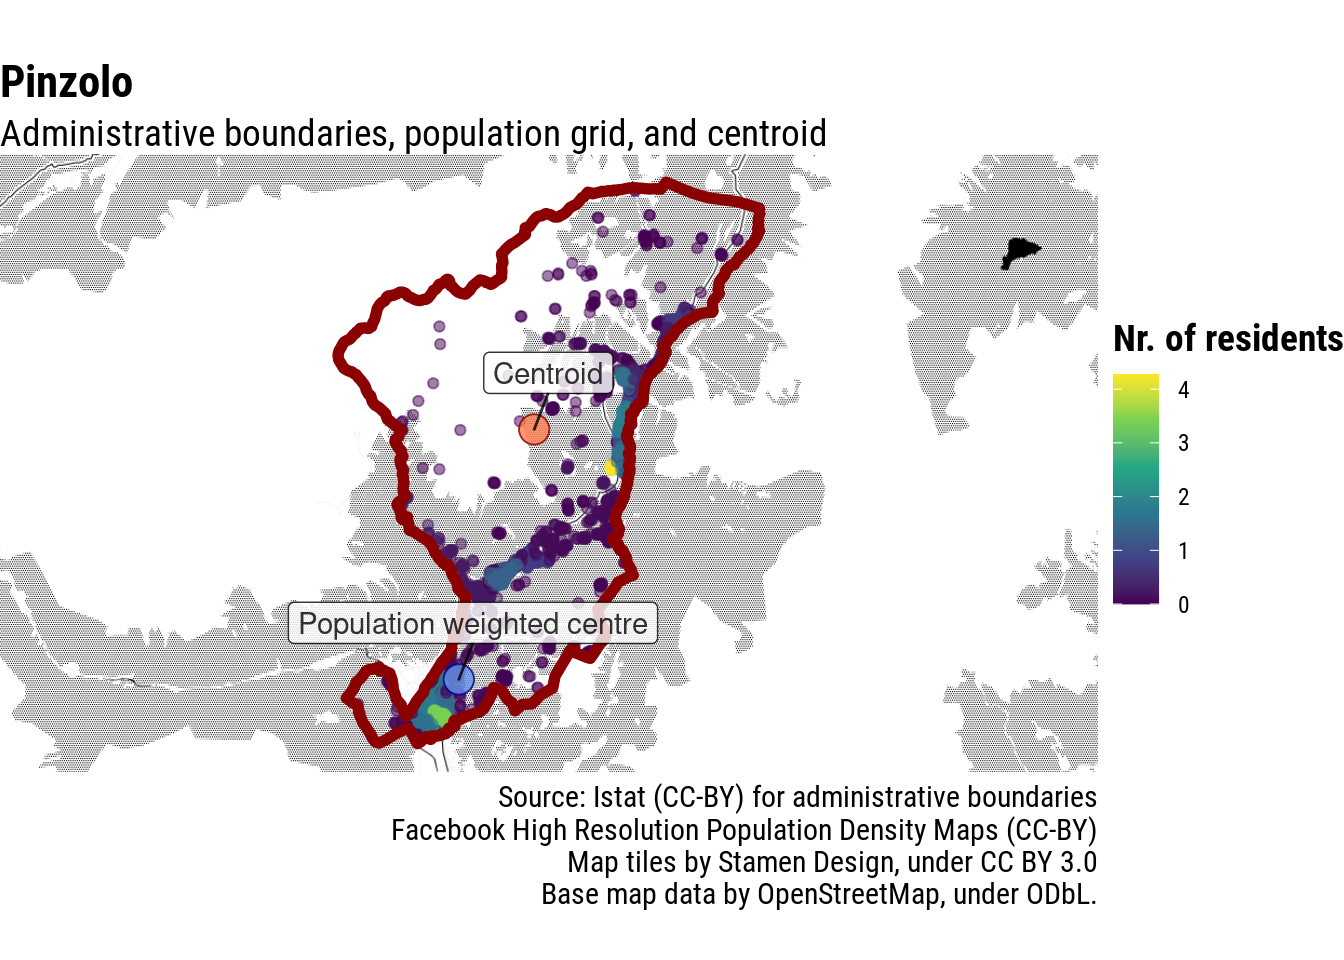
But perhaps most importantly, re-calculating the population-weighted centre with these parameters and increased detail, here is what I get:
Bingo! Top score!!! 🎯🎉🍾🏆
P.S.: while writing this post, as I was slowed down by some of the tedious aspects that often accompany geocomputation with data released by the EU, I made a package for the R programming language that eases some of the pain. It’s an early release, and will become more feature-rich in the coming month, but you may still give it a spin. The package is available on GitHub, and already has a preliminary vignette outlining some of its features.